
How to Calculate Project Duration for Construction
Two weeks before handover, the superintendent is staring at a Gantt chart that no longer resembles the jobsite. The slab pour slipped, the tower crane rental is accumulating standby time, and the owner wants a revised completion date by tomorrow morning. The original schedule still shows a clean finish, but the crews know the truth: inspections are waiting, weather has narrowed the workable window, and several trades are competing for the same access route.
That situation exposes the weakness in most duration calculations. Teams often choose one optimistic number, add activities to a bar chart, and treat the finish date as fact. A defensible duration comes from the longest chain of dependent work, after crew availability, rental windows, inspections, procurement, payment timing, and weather have been built into the logic. This is how to calculate project duration in a way that can survive a schedule review and still make sense in the field.
What Actually Controls Project Duration
A project can have the same quantities, crews, and production rates yet finish on different dates. The controlling conditions are whether labor, materials, rented equipment, access, permits, and workable weather are available when each activity needs them. If one condition fails, calendar duration changes even when the measured scope does not.
Consider a concrete pour competing with a delayed inspection, a restricted delivery route, and a crane rental that cannot remain on standby indefinitely without cost. The finishing crew may still be ready, but the work now includes waiting and coordination. A calculation based only on crew productivity misses the time that can determine handover.
Practical rule: A task duration must describe the time required under the conditions in which the task will actually be performed, not the time it would take in an uninterrupted demonstration.
Separate effort, elapsed duration, and waiting time in the schedule. A crew may require a fixed amount of productive labor, while the activity spans more calendar days because that crew is shared, the next area is not released, or an inspection must occur first. Payment timing can create another hold when a vendor or rental provider requires approval before releasing equipment or continuing service. Weather adds uncertainty too, particularly when rain, temperature, or site conditions reduce workable hours.
Do not add every activity duration together. Many tasks overlap, while one missing dependency, delayed payment, equipment release, or weather interruption can extend the finish date. For planning and reporting, duration is better represented as a range with conditions than as one fixed date.
Why the critical path matters
The Critical Path Method, or CPM, identifies the longest continuous chain of logically connected activities. That chain sets the shortest possible project duration under the network's assumptions. Activities with zero total float sit on that path, so a delay to one can threaten the project finish.
A software-generated red path is only a starting point. Check whether the logic reflects actual site operations. Forced finish-to-start links, omitted permit gates, shared crews, unrealistic equipment assignments, and unplanned rental holds can produce a tidy schedule that no superintendent can execute.
A reliable forecast develops in layers:
- Scope definition establishes the work that must be completed.
- Duration estimating assigns time under expected field conditions.
- Dependency mapping shows what can overlap and what must wait.
- CPM analysis identifies the controlling path.
- Resource and risk review tests crew, equipment, weather, access, and payment assumptions.
- Progress updates replace assumptions with actual production and revised constraints.
The useful result is a completion window, not just a date. It should show the activities consuming float, the equipment and approvals tied to the forecast, and the conditions that could move the finish.
Defining Scope and Building the WBS
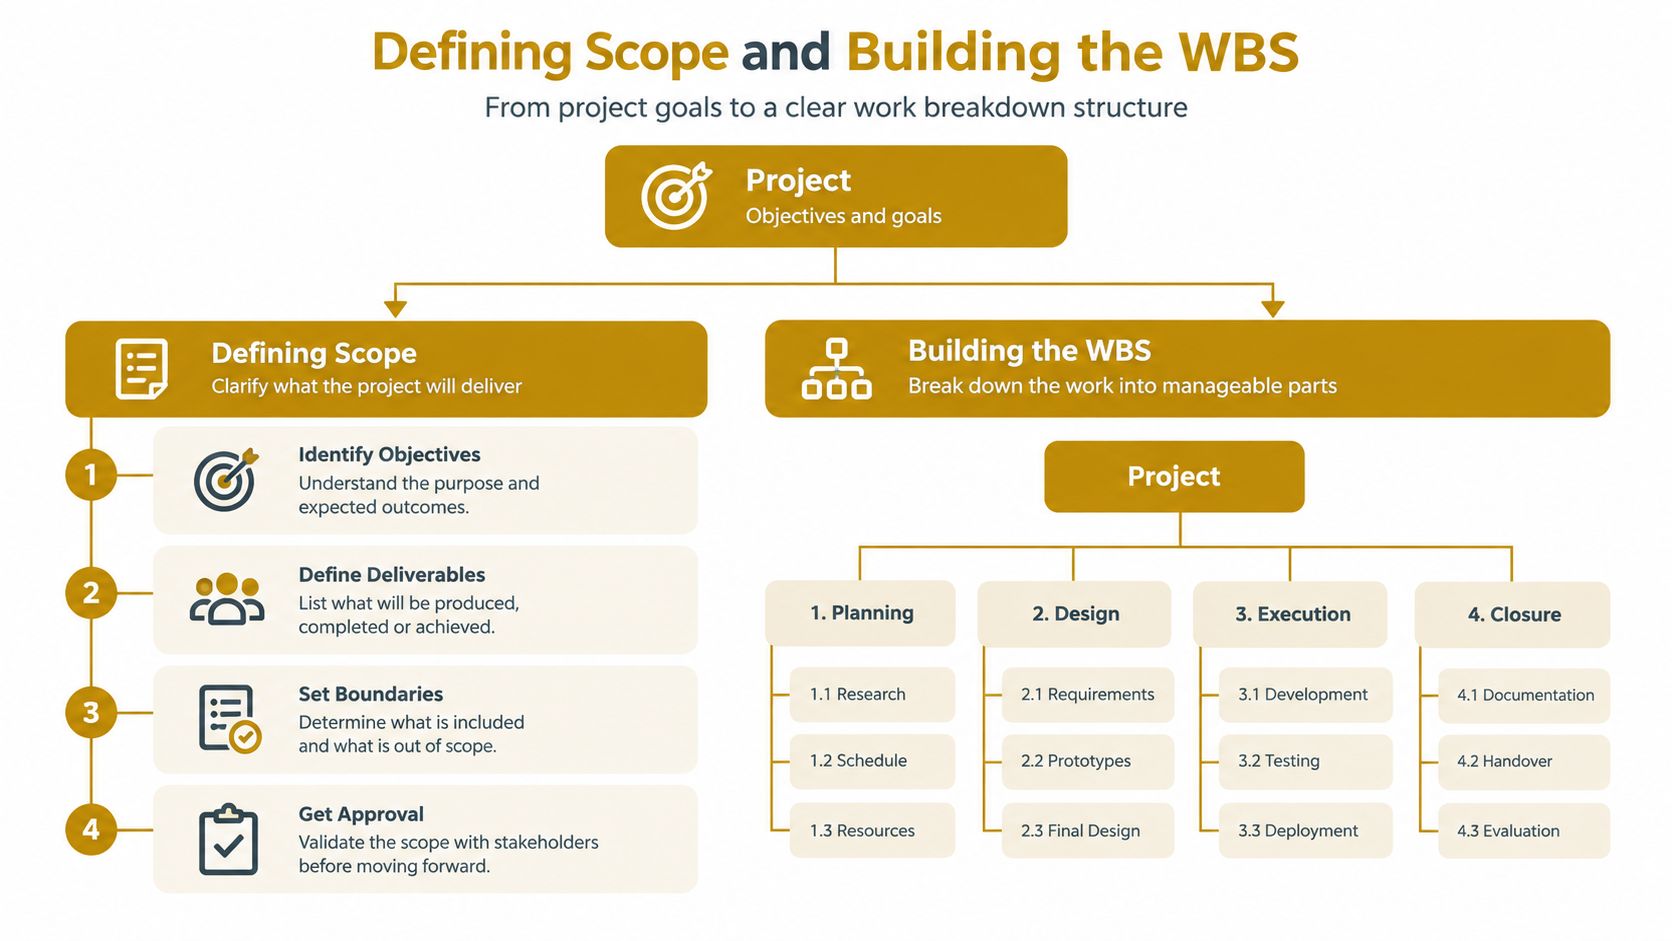
Duration math is only as reliable as the activity list beneath it. Start with the contract drawings, specifications, procurement requirements, permit conditions, and owner-furnished items. Extract the deliverables first, then break each deliverable into work packages that a field team can recognize, assign, measure, and close.
A Work Breakdown Structure, or WBS, isn't an organization chart and it isn't merely a list of drawing titles. It should represent the physical and administrative work that consumes time. “Structure” is too broad for a useful duration estimate. “Install level-two structural steel in gridline zone,” “complete weld inspection,” and “release area for deck installation” are closer to schedulable activities because each has a defined output.
Build activities from deliverables
Use the following sequence when developing the scope baseline:
- List contract deliverables. Include foundations, structure, enclosure, interiors, commissioning, testing, closeout, and approvals.
- Break deliverables into trade packages. Separate concrete, reinforcing steel, formwork, electrical, plumbing, HVAC, fire protection, finishes, and external works where their crews and constraints differ.
- Decompose by location or zone. Floors, wings, gridlines, utility corridors, and site sectors often reveal parallel work that a trade-only list hides.
- Add nonphysical gates. Permits, submittals, inspections, testing, client decisions, utility releases, and owner-supplied equipment can control field work.
- Define procurement activities. Long-lead materials and rented equipment need approval, fabrication, delivery, setup, operating, and return activities.
A practical planning level is an activity that represents roughly 8 to 40 work hours, as specified in the project brief. That range is a working guide, not a law. Break work down further when a smaller task has a separate predecessor, crew, inspection, or risk. Keep it larger when excessive detail would create administrative noise without improving control.
Give every activity a start and finish condition
Each WBS item should answer three questions:
- What allows it to start? For example, approved shop drawings, released area, completed predecessor, delivered material, or available crew.
- What proves it is finished? For example, installed quantity, passed inspection, signed test record, or accepted handover.
- Who performs it? Name the trade, crew, subcontractor, inspector, vendor, or owner representative.
Include provisional sums, owner-supplied items, and temporary works explicitly. If an owner-supplied switchgear package must arrive before energization, that procurement and delivery condition belongs in the network. If a concrete washout arrangement, access restriction, or environmental control affects a pour, it belongs in the activity assumptions rather than remaining as an informal field note.
The WBS becomes the schedule's input layer. If the team never defines a permit release, inspection, rental mobilization, or material delivery as an activity or constraint, CPM can't account for its effect.
Estimating Activity Durations That Hold Up
A duration estimate should have a basis that another scheduler can inspect. The strongest schedules combine expert judgment, analogous estimating, parametric estimating, and bottom-up estimating, rather than relying on one unsupported guess. The guidance on estimating activity durations also highlights the practical problem behind weak estimates. In a 2025 study cited there, 63% of respondents identified insufficient time as the main barrier to reliable task-duration estimation, while 44% cited a dismissive approach to planning and 39% cited estimates made to satisfy expectations rather than reality.
Three methods are especially useful on construction work.
Use production rates when the quantity is measurable
Apply a verified rate to a measured quantity. For example, if a crew must install 120 linear feet of conduit at 12 linear feet per electrician-day, the calculated effort is 10 crew days. That is a useful starting point, but the scheduler still needs to confirm crew size, access, lift availability, material staging, work-hour rules, and whether the rate reflects this project's conditions.
Historical production records are usually stronger than a generic table when the work, crew, and site resemble prior jobs. Analogous estimating can also provide a quick check. If a similar façade zone took a certain calendar duration, compare the access, weather exposure, crew composition, and inspection requirements before carrying that duration forward.
Divide known work by available resources
When the scope is clear but a reliable productivity rate isn't available, calculate duration from total work and usable resources. A 400 cubic yard slab pour handled by three finishers during a 6-hour pour day requires a resource-based estimate that reflects the actual placement and finishing arrangement, not a theoretical crew working without interruption.
This method forces practical questions. Is the pump booked for the full window? Can trucks reach the discharge point? Does the finishing crew include the people needed for edges, joints, curing, and cleanup? If the answer changes by zone or shift, split the activity rather than hiding those differences inside one average.
Use PERT when uncertainty is material
PERT uses optimistic, most likely, and pessimistic estimates:
Expected duration = (O + 4M + P) / 6
Suppose steel erection has an optimistic duration of 8 days, a most likely duration of 12 days, and a pessimistic duration of 20 days. The weighted result is 13 days, calculated as (8 + 4 × 12 + 20) / 6. The formula gives the most likely case greater influence while still forcing the team to discuss disruption.
Don't pad every activity. Hidden padding makes it impossible to tell whether float is real, and it can produce a schedule that is optimistic by an unknown amount. Put uncertainty into explicit ranges, document the reason for each scenario, and reserve contingency where management can see and control it.
| Method | Best used when | Key formula | Common pitfall |
|---|---|---|---|
| Productivity rate | Quantities and comparable production records are available | Quantity ÷ production rate | Applying a rate without checking access, crew, or site conditions |
| Work divided by resources | Scope is known but the rate is uncertain | Total work ÷ usable resource capacity | Treating nominal crew capacity as fully productive time |
| PERT three-point estimate | Weather, approvals, procurement, or technical risk creates a meaningful range | (O + 4M + P) ÷ 6 | Padding all inputs instead of documenting specific uncertainty |
Record the assumption beside every estimate. State the quantity, crew, shift, production basis, access condition, equipment requirement, and inspection assumption. That record turns a disputed date into a forecast that can be updated when conditions change.
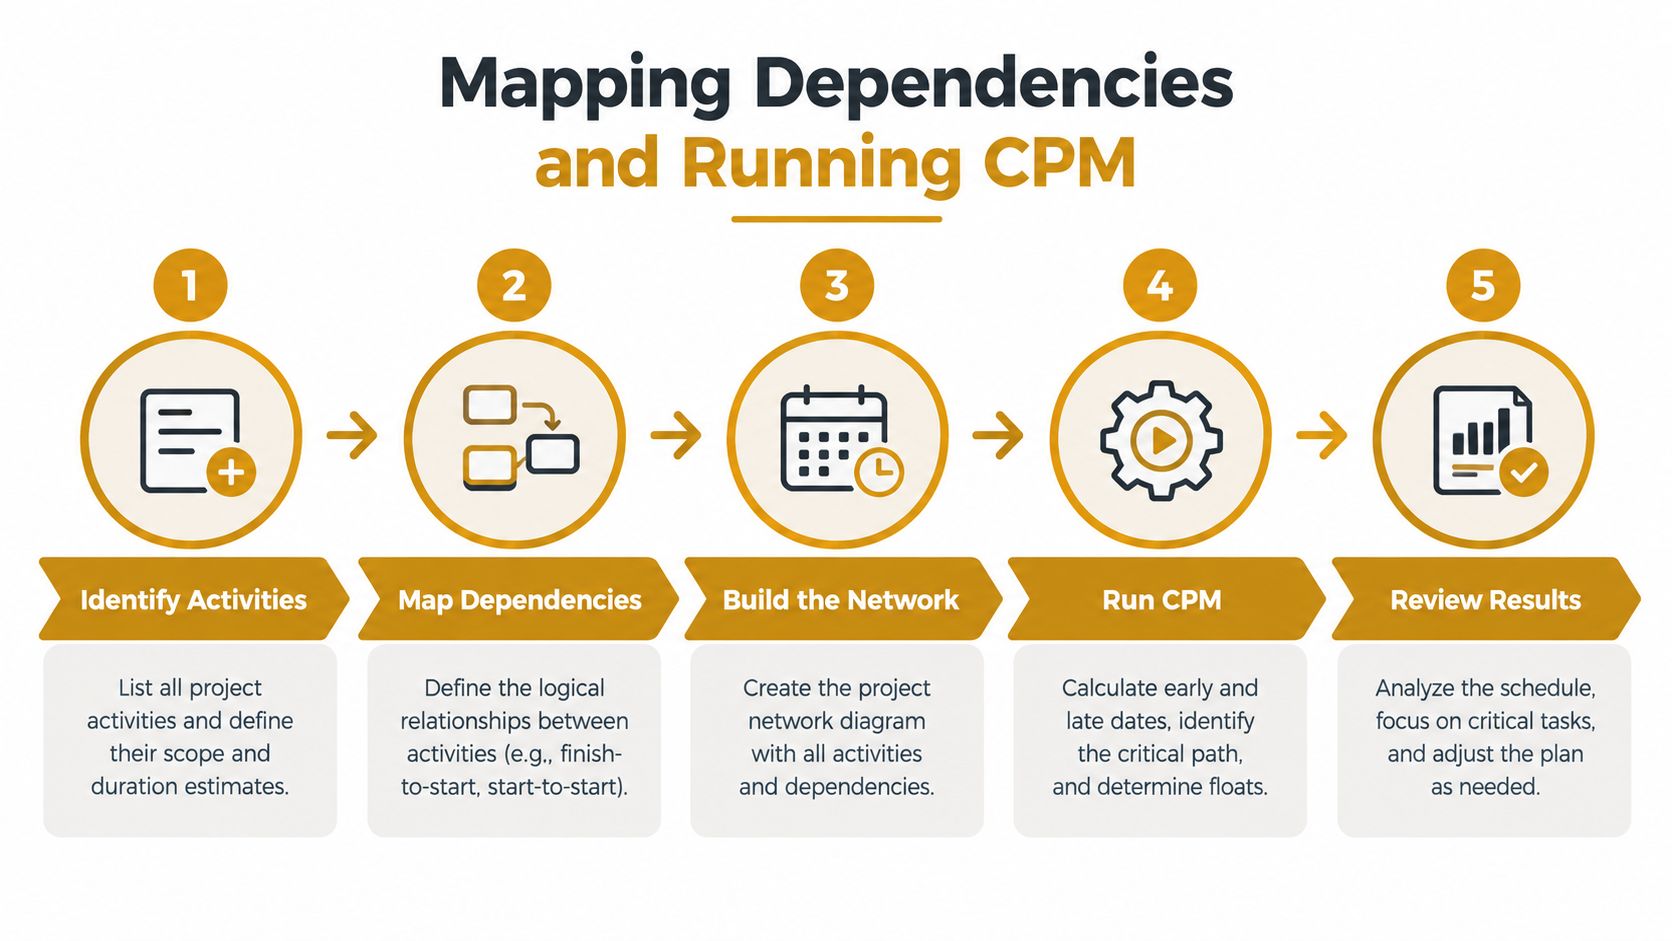
Mapping Dependencies and Running CPM
Once each activity has a duration, the schedule becomes a network of relationships. The most common construction relationship is finish-to-start, such as completing a foundation section before starting the wall framing that depends on it. Start-to-start relationships support controlled overlap, such as beginning rough-in in one released zone as framing starts in another. Finish-to-finish and start-to-finish relationships exist, but they require careful justification because schedulers often use them to force a visual result rather than represent physical logic.
Use a small foundation-to-superstructure network to test the reasoning:
- Permit release precedes site preparation.
- Site preparation precedes foundation work.
- Foundation completion releases framing.
- Framing starts the window for electrical, plumbing, and HVAC rough-in.
- Rough-in completion releases enclosure or drywall in the affected zone.
- Interior and exterior completion feed final inspection and handover.
The activities should branch where work can proceed in parallel. Don't link electrical, plumbing, and HVAC sequentially merely because one line is easier to draw. Add a relationship only when physical access, safety, inspection, design, or resource conditions require it.
Run the forward pass
The forward pass calculates the earliest possible timing:
- Early Start, ES: the earliest point an activity can begin.
- Early Finish, EF: ES plus activity duration.
- For an activity with several predecessors, ES is governed by the latest predecessor finish.
The PMI explanation of critical path calculations describes the standard two-pass workflow and float formulas. Begin at the project start, assign the first activity an ES, then move through the network calculating EF. At each merge, use the maximum predecessor EF because the successor can't start until every required predecessor is complete.
Run the backward pass
The backward pass works from the required project finish:
- Late Finish, LF: the latest point an activity can finish without delaying the required completion.
- Late Start, LS: LF minus activity duration.
- At a split, the predecessor's LF is governed by the earliest successor LS.
Calculate total float as LS minus ES, or LF minus EF. Calculate free float as the earliest successor ES minus the current activity EF. Total float tells you how much delay the project can absorb overall, while free float shows whether a delay will immediately affect downstream work.
The project duration is the length of the critical path, the longest connected chain through the network. Any activity with zero total float is on that path. In the Gantt view, highlight those activities, then inspect paths with little remaining float. A near-critical path may not control the finish today, but a modest delay to a permit, façade zone, or commissioning package can make it critical tomorrow.
Watch for four mapping failures:
- False constraints: A finish-to-start link reflects habit, not a physical requirement.
- Missing gates: Permit releases, inspections, testing, and owner decisions are absent.
- Blocked concurrency: Activities that could proceed by zone are forced into one sequence.
- Unstated external conditions: Weather-sensitive work is shown as certain rather than conditional.
CPM identifies the controlling logic. The scheduler must still validate whether crews, equipment, and site conditions can execute that logic.
Adjusting for Resources, Site Logistics, and Uncertainty
A clean CPM network assumes that activities can start when their predecessors finish. Real sites add another condition: the required resources must also be available. If electrical rough-in and mechanical rough-in both need the same access platform, or two critical operations need the same crane, resource leveling can push one activity later and create a different critical path.
Run the first CPM analysis without hiding resource conflicts, then perform a resource review. Identify shared crews, cranes, hoists, pumps, lifts, temporary power, delivery routes, and inspection personnel. If the schedule requires one tower crane to serve steel erection, façade panels, and rooftop equipment during the same window, the crane isn't just a resource field. It is a schedule constraint that needs a release sequence.
Turn logistics into scheduled work
Rental equipment deserves the same treatment as permanent materials. Calculate the rental window from the activities that need the equipment, then include:
- Mobilization: delivery, assembly, setup, testing, and operator orientation.
- Operating window: the activities that consume the rental.
- Idle exposure: weather holds, inspection waits, access conflicts, and delayed predecessor work.
- Demobilization: dismantling, pickup, cleaning, and site release.
Concrete logistics show why this matters. A pump may be booked for a planned pour, but a late inspection or incomplete reinforcement can leave the pump waiting. A washout control, access route, or environmental condition can also affect whether the pour can proceed cleanly. The scheduler should link equipment readiness to pour readiness rather than assume that delivery equals productive use.
Power and water tie-ins need similar logic before interior fit-out. Tower crane erection must precede the lifts that depend on it. Material delivery must precede installation, but the delivery itself may require a road closure, spotter, storage area, or approved time window.
Field test: If the foreman can name a resource that could stop the activity, that resource belongs in the schedule conversation.
Record the distortions that consume float
Weather, subcontractor stacking, vibration restrictions, late inspections, payment interruptions, and material release delays don't affect every activity equally. A 2025 renovation-duration study identified 45 uncertainty factors, with financial problems, inflation, payment delays, weather, and late consultant inspection among the top five factors described in the study data. The same source reports weather as the most common uncertainty source in another 2025 paper, at 42.3%, with an average impact of 8.4 days, while resource availability ranked second at 37.8%, with an average impact of 6.9 days.
| Site factor | Schedule impact | Mitigation |
|---|---|---|
| Weather-sensitive excavation, roofing, or concrete work | Reduces workable production windows and can consume float | Add a weather-sensitive contingency, protect work areas, and resequence sheltered tasks |
| Shared crane, hoist, or access platform | Forces competing activities into sequence | Level resources, zone the work, and publish a lift or access release plan |
| Late inspection or testing | Blocks successor work despite physical completion | Schedule inspection requests as activities and use justified overlap where allowed |
| Subcontractor stacking | Crews lose access, staging, or safe work fronts | Sequence trades by floor or zone and define area handoff conditions |
| Payment or procurement delay | Holds material release, subcontractor mobilization, or equipment availability | Track commercial approvals as schedule gates and escalate before float disappears |
| Rental delivery or return conflict | Creates standby, missed mobilization, or extended rental exposure | Confirm dates, access, setup, operating duration, pickup conditions, and contingency |
Don't bury these issues in a general buffer. Tie each risk to the activities it can affect, then recalculate the network after leveling resources and changing logic. The critical path that survives this review is far more useful than the one produced from unlimited-resource assumptions.
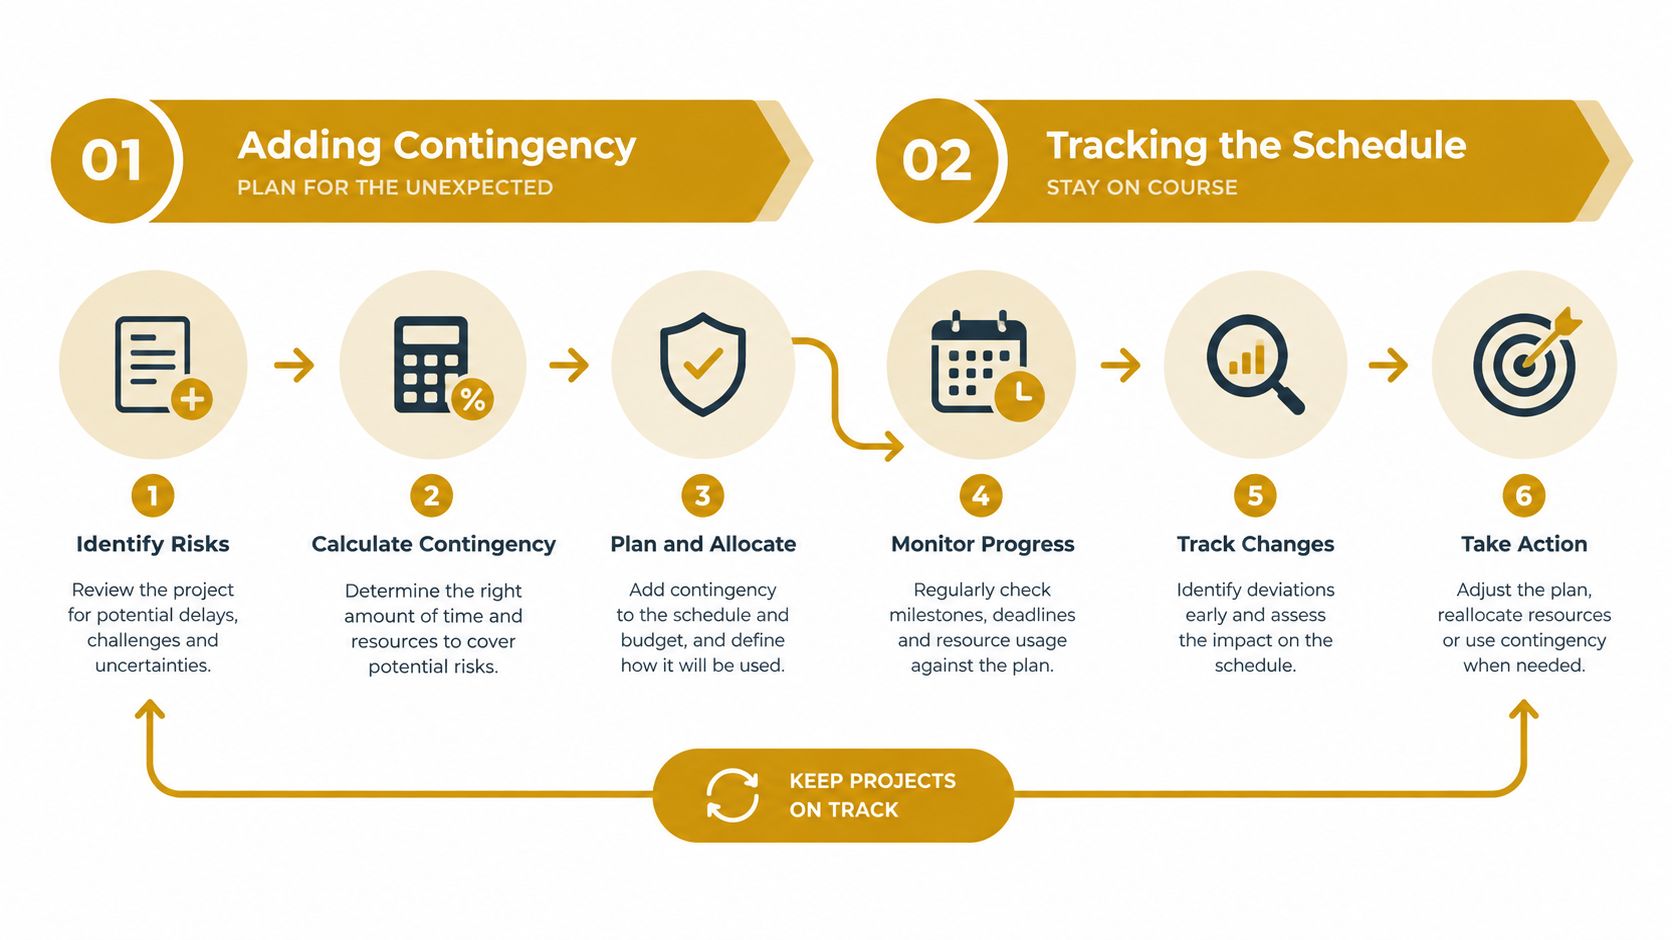
Adding Contingency and Tracking the Schedule
A single deterministic CPM result tells you what happens if the estimates and logic hold. It doesn't tell you how likely that result is. For uncertain work, keep optimistic, most likely, and pessimistic durations in the schedule risk model, then use PERT or Monte Carlo analysis to produce a range rather than presenting false precision.
A simple PERT example makes the distinction clear. If a concrete pour could take 2 days in favorable conditions, 4 days under the expected plan, or 9 days after disruption, the weighted expected duration is (2 + 4 × 4 + 9) / 6, which equals 4.5 days. The number is useful for planning, but the range remains important because the pessimistic case may consume the float of follow-on work.
Recent construction-scheduling research continues to use PERT and Monte Carlo because deterministic CPM timelines can miss uncertainty. One 2025 study reported that its baseline schedule had less than 28.7% probability of being met, while a 60-day finish had an estimated 80% chance, as described in the Monte Carlo scheduling research. Those figures aren't a universal rule for construction, but they demonstrate why the baseline date and a confidence range answer different questions.
Choose where contingency lives
You can place schedule protection in several ways:
- Activity-level allowance: Useful when a specific task, such as weather-exposed concrete or a difficult tie-in, carries the known risk.
- Milestone buffer: Useful when several activities feed a handover, inspection, or equipment return.
- Project-level reserve: Useful when management needs a controlled allowance for risks that can't yet be assigned to one activity.
Explicit buffers make risk visible and help the team explain consumption. A project-level reserve gives management flexibility but can hide which work is deteriorating. I prefer named allowances for material risks, with a separate reserve for unknown conditions.
Reforecast from actual production
Use a weekly look-ahead for the next three weeks. Pull activities from the CPM schedule, verify their start conditions with the superintendent and foremen, and record constraints such as labor, drawings, deliveries, access, inspections, weather, and equipment.
Then compare planned versus actual productivity. Earned value measures, including Schedule Performance Index, SPI, and Cost Performance Index, CPI, can support control-account review when the project has a reliable earned value structure. For field control, actual installed quantities and remaining quantities often expose a problem faster than a status percentage.
At least monthly, recompute the forecast finish from remaining work and current performance. Don't keep defaulting to the original contract completion date when the remaining production rate has changed. The schedule is a monitoring loop, not a document created once and protected from bad news.
Stop Treating Duration Like a Single Date
A published finish date is necessary for contracts, procurement commitments, owner communication, and equipment planning. It isn't the whole forecast. A single date compresses uncertainty into a number that looks precise even when weather, payment, inspections, resources, and production rates remain variable.
Use probability bands from the CPM network:
- P50: A central planning point for internal commitments and working targets.
- P80: A more conservative basis for client handover planning.
- P90: A prudent reference for equipment return commitments and permit windows when the cost of being early or late is significant.
These labels only help if the team calculates them from real ranges and updates them. Don't assign confidence levels to a date because a stakeholder prefers a particular finish. The range should reflect the network, the assumptions, and the risk inputs.
Publish a one-page schedule snapshot
A useful weekly snapshot should show:
- The current critical path and its forecast range.
- The three activities burning the most float.
- Equipment rental windows tied to remaining work.
- Weather, payment, inspection, and resource constraints.
- Contingency consumed and contingency remaining.
- The change from the previous forecast.
Update the probability band, not just the Gantt finish bar. If the P50 and P80 dates are moving farther apart, uncertainty is widening and management needs to act. If they converge as procurement, inspections, and production stabilize, the forecast is becoming more defensible.
Working truth: The contract date is a commitment. The probability range is the operating forecast.
That distinction changes behavior. A superintendent can protect a rental return by planning against a conservative finish without claiming the project will definitely take that long. A project manager can use the central date for internal coordination while escalating early when the conservative date threatens a client milestone. The team can also test whether a delay affects the overall finish or merely consumes free float.
Tomorrow, review the current schedule with the people who control the work fronts. Confirm every critical and near-critical activity, add missing rental and inspection logic, document the assumptions behind the durations, and publish a probability range alongside the contractual finish date. For concrete work and site logistics that need dependable containment and clearly planned rental windows, visit Reborn Rentals to check equipment options, dates, locations, and delivery requirements before the next pour is scheduled.